
Hello, my name is John Nordberg. I have been getting some notoriety lately for my predictions of solar activity and sunspots. Recently, I have been interviewed by Art Bell on his radio talk show, Coast to Coast AM, and with Eliot Stein on Broadcast.com. The purpose of this page is to summarize my predictions and compare them with the actual solar activity that has occurred since 8/31/1999 when I publicly made the predictions on Art Bell's show.
First of all there are many measures of solar activity. Some are:
These are just a few parameters. There are many more. If you would like to independently verify my information, two great websites are:
Solar Terrestrial Activity Report
You might be wondering, what exactly is this guy's solar theory. In short, it can be summarized as:
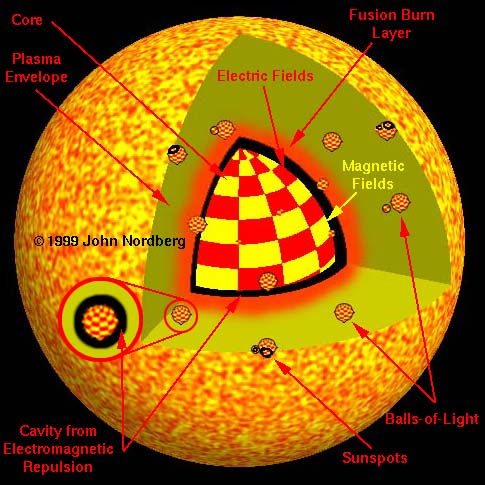
This graphic summarizes the overall structure:
As the sun wobbles -- due to gravitational interaction with the planets -- it also rotates on its axis. Since the core is one solid object, and the outer plasma layer is a fluid plasma, these two main parts of the sun will wobble differently. Imagine a washing machine that has an unbalanced load. As the inner drum -- the basket part that holds the clothes -- spins out of balance, it hits the outer drum -- the part that holds the water -- of the washing machine. In the same way, as the core of the sun wobbles within the plasma layer, it electromagnetically interacts with the plasma layer. The core "bumps" into the plasma. In essence, this sets up massive electromagnetic waves on the core of the sun that are not harmonic, which in turn induce larger than normal elementary particles -- the particles that are at the center of sunspots. As these unusual particles decay, they increase the sun's solar flux. Often, they escape from the surface of the sun and explosively decay in the corona, making the millions, or billions of x-ray bright points that constantly surround the sun -- but are even more numerous when the sun is active. These decaying balls-of-light in the corona also superheats the corona beyond what traditional theory predicts.
Traditional astrophysical theory does not predict what my Ball-of-Light Particle Model predicts with respect to the sunspot cycle. Normally, astronomers dismiss that the planets could possibly have any impact on solar activity because they use the wrong physics. What they do is this:
With my theory, I do this:
The Ball-of-Light Particle Model predicts a much greater impact on the sun by the gravitational pull of the planets than does the traditional "tidal/fusion" theory. The sun is spinning. The sun has a tremendous amount of angular momentum. It takes very little wobble of the core within the outer plasma layer to create huge forces, to create the dramatic increases of energy that occur within the solar cycle.
I made my predictions of solar activity on 8/31/1999 on the Art Bell show.
This chart shows an inverse relationship, dips are increases in solar activity. The green line called "Now" was on the date of the show. It indicates a striking dip peaking at 11/30/1999. This dip represents a dramatic increase in solar activity. Is this the solar activity increasing as predicted. Yes. Now, how does one quantify this, or prove this? It is too early to tell. However, a magnified and inverted graph of our current time frame would look like this.
The smaller peak on the left -- halfway between the black line and the left edge -- corresponds to the increased solar activity at the end of August and beginning of September. The following dip, to the left of the black line, corresponds with solar activity that did diminish. This dip in solar activity did occur. The jagged portion of the red line just to the left of the black line represented an unsettled time for the sun, a time marked by occasional Coronal Mass Ejections, CMEs, and solar flares. The most striking point on the chart from my point of view was the dip on 11/6/1999 that just precedes a dramatic increase through 11/26/1999. This point made it an obvious target for a prediction. I predicted there would be a dramatic increase in solar activity on 11/6/1999
What happened to the sun's solar activity on 11/6/1999? Was there any noticeable increase? Yes. The chart for the sun's X-Ray Flux -- which I think is one of the best indicators of short-term changes in solar activity because it is due to decaying balls-of-light -- looked like this:
Can you see any increase in activity on or about November 6th? It looks to me like I missed it by about 6 hours. Other indicators of solar activity such as sunspots were up as well. But, you may ask, what was happening before this time? A similar chart from 11/3/1999 looked like this:
Notice how the blue line is bottoming out. While the sun was active, and there were major decaying balls-of-light creating bursts of x-ray radiation, overall, the chart was low. You may ask, was it a fluke? Were the x-rays just higher on the end of 11/5/1999 and on 11/6/1999? No, it wasn't. A chart from 11/9/1999 looked like this:
There is no doubt, there was a dramatic increase at almost the exact time predicted. From 11/11/1999:
The chart is still high. From 11/13/1999:
From 11/16/1999:
(It is interesting to note that during the M-Class flare activity on 11/14/1999, tropical storm Lenny quickly grew into hurricane Lenny in the Caribbean. I have noticed a similar occurrence with the India Supercyclone on October 27 and with other hurricanes. During the final stages of the Supercyclone that hit India -- with very tragic results -- there ware powerful bursts of radiation from the sun, and the power of the storm intensified very quickly. People may recall that on September 12, 1999, hurricane Floyd grew rapidly in strength from 110 to 145 mph winds in just a few hours. During that same time frame a strong burst of radiation hit earth. Now I understand that most people think the storm gains its strength from the water below, and I do not doubt this, but when a massive storm changes its strength so rapidly, how can such a change happen from the water below? A 500 mile wide storm traveling at say 30 miles per hour can not suddenly pass over a patch of significantly warmer water, can it? Anyhow, it is an interesting correlation that I have noticed numerous times.)
From 11/18/199:
From 11/20/1999:
Obviously, the dates of 11/19/1999 and 11/20/1999 calmed down, but notice that the overall values for X-ray Flux are still much higher than normal.
For 11/22/1999:
Wow! Again, the Ball-of-Light Particle model predicts each of the spikes in X-ray flux is caused by an exploding ball of light! Traditional theory of star formation -- a collapsed ball of gas and dust burning via nuclear fusion -- does not predict such sudden increases of X-ray solar flux.
For 11/26/1999:
Again, my model of sun predicts that the inner planets -- Mercury, Venus, and Earth, will affect the core of the sun, and its wobble. The peak for this change in acceleration will occur somewhere between 11/26 and 11/28/1999. Therefore it is to be expected that there would be dramatic solar activity on these dates.
For 11/28/1999:
It is not visible on this chart, but on the 28th there was an additional M-class flare. A total of 8-9 M-class flares and an X-class flare! Again, this chart represents the actual results for what I predicted a couple of months ago would be a major peak in solar activity. Wow. Now let us see if the sun starts to settle down in the next few weeks. Remember, my charts represent how the sun's acceleration is changing. This peak represents when the sunspots would be created. According to the Ball-of-Light Particle Model, the latest sunspots that were created in the last couple of days are just now starting to float up through the outer plasma layer of the sun. They are like time-delayed bombs, they could explode at any time, and some may last weeks. As the sun rotates, sunspots that are just now forming, or will surface in the next week, will rotate around and come into view. Some of these new spots may only be on the back side of the sun.
What do you think of this last chart?
As far as sunspots are concerned, the count is much lower than I expected for this date. I will put up information specifically on sunspots within the next week.
Anyhow, back to the current surge of energy from the sun. There is no doubt, x-ray solar flux has increased during my predicted time frame. Other indicators of solar activity such as solar flux and sunspot numbers have been up as well, but did not stay as high as I thought they would. Will solar activity keep increasing through the end of the month? I predict it will. Will it take until February of next year to calm down? I predict it will?
Note: Between the end of the 28th and the end of the 29th, an event happened that was very interesting. The X-ray flux exhibited a slow decay pattern, with periodic spikes. This is the type of electromagnetic signature I would expect from a decaying ball-of-light that popped out of the surface of the sun. Seeing this signature, I made many attempts to find SOHO images and other images of the sun during this time frame. Unfortunately, every space-based satellite that takes images of the sun appears to have stopped working during this time frame. For example, the SOHO had images like this posted:
Note how the image is rotated and blurred.
The TRACE satellite apparently received no images of this long-term event because it had its sensors focused on the left side of the sun instead of the right side, or the whole sun! Unbelievable!
The coronal image that was posted -- which should have allowed us to see the decaying ball-of-light -- wasn't even from the right date!
Thankfully, there were radio images of this decaying ball-of-light from a ground-based Japan system. In these images, you can see a very large "radio bright" object that was ejected from the sun and just hovered over its surface decaying.

This is an amazing object to be missed by so many satellites! Note the temperatures in degrees K! There were numerous smaller objects that were apparently ejected as well as this larger object. This is a radio image, and it is not as clear as a SOHO or TRACE image would have been, but it is pretty obvious to me just what this object was.
And for December 1st, 1999:
This is the first chart after my predicted peak of the 26th to the 28th. Note how the blue line has dipped to the lowest point since the beginning of November. This is key, and matches predictions.
On 11/6/1999 the alignment of the planets looked like this:
Credit: Solar System Live by John Walker (Date and red lines added by John Nordberg)
The two largest planets, Jupiter and Saturn, had pulled the sun dramatically off the barycenter of the solar system in their direction. Venus, earth, and Mercury -- all fast moving planets -- were almost aligned and were turning this "corner" together -- the "corner" defined by the line between the sun and Jupiter/Saturn. The gravitational pull of these three planets had reached the point where they stopped pulling the sun towards Jupiter/Saturn -- in essence, helping, and making the sun harmonic -- and started to pull the sun upwards (in the picture) and away from Jupiter/Saturn -- in essence, fighting, and making the sun nonharmonic. This rapid change in the sun's wobble from the barycenter induced the increase in solar activity.
Many scientists have attempted to predict solar activity. This was the first accurate prediction of a dramatic increase in solar activity in history. I know of no prior predictions that were made so far in advance and were so accurate.
What happens if I continue to predict sunspots accurately with this technique? The current astrophysical theory will come tumbling down like a house of cards. My technique does not agree with the traditional theory that stars are collapsed balls of gas and dust burning by nuclear fusion.
Are scientists watching my website? Yes. Are they talking about it publicly? No. If my predictions continue, will it force them to? Yes. Will I "publish" a scientific journal paper? Yes and No. In a traditional journal, no. In essence, you are reading it.
Is this the solar maximum? Review the first chart above. The overall dip in the chart -- representing the overall peak in cycle 23 of sunspots -- is centered about at 6/9/2005. The largest peak in the cycle 23 will probably occur on about 5/26/2004, and the last big peak before cycle 23 settles down appears to be about 9/14/2005. There is no doubt, these predictions do not agree with what solar astronomers are now saying! If my predictions continue to come true, there is no doubt that my theory is more likely to be correct and traditional theory is more likely to be wrong.
At this time, every prediction I have heard or read about states that the solar max of cycle 23 will occur towards the end of this year, or early in 2000. Some just say in 2000. However, some have made some predictions that are just hard to argue with:
I won't name names but a three year guess for when the Solar Max will occur is hard to argue with.
A natural question is, How does your predictions compare with past data? Personally, I can't believe it. There is such a high correlation that quite frankly, I believe my theory has to be correct. However, I have had so much to do, I have not had time to put up on my website this comparison. I hope to do so soon. However, I must first obtain copyright permission from a key individual in order to use his graphics.