Other Topics — Earthquakes
Predicting Earthquakes, Earthquake Watches, Electromagnetic Signals from Fracturing Rock, “Solid Crust Tides,” and an Earthquake Warning System.
Note: ![]() Expands
Expands ![]() Collapses
Collapses
Earthquakes — Introduction
I am sure you are familiar with tides. Tides — the rise and fall of water levels in major bodies of water and oceans — are caused primarily by the gravitational pull of the moon. (The sun and the earth's rotation also have some impact.)
Take for a moment and imagine how thes forces exert huge forces on these bodies of water. Imagine how much force is needed to lift suge huge amounts of water!
The key detail I wish to emphasize is those same forces also lift and lower the earth's crust — they are sometimes called “earth tides.”
Earthquakes — Earth Tides
Barycenter
The earth has a barycenter — its center of mass.
Position
Each day the earth move's a certain amount in its orbit around the sun. On day 1 the barycenter of the earth has position 1, on day 2 the earth's barycenter has position 2.
Change in Position
The earth moves a certain distance from day 1 to day 2.
Velocity
If you take the change of the earth's position from day 1 to day 2 and divide it by one day you get the earth's velocity.
Acceleration
Of course the earth's acceleration can be calculated as well.
MICA
Of course, you could try to calculate how earth moves through space on your own. Or, you could let professionals do it, and use their information. Interestingly, the United States Navy has been doing this — and they are very good at it. The produce a software program that you can purchase and use on your computer. It is called, Multiyear Interactive Computer Almanac (MICA). Presently, this software has a date range from 1800 to 2050. So you can analyze where the was, back to the year 1800, or where the earth will be out to 2050. Of course, this software can also do this for all of the planets, the moon, and the sun!
Getting the data
So imagine this. You open up Mica, enter your date range, pick your planet — earth, of course — tell the software you want the positional x, y, z data for earth — its position from the solar system's barycenter — and click OK. Boom! It generates the x, y, z data for earth's positions.
Next, you export it, and import into a spreadsheet. You now have columns: date, x, y, and z. This is your position data over time.
Next, create a column that calculates how much the earth has moved since the last day. This is its velocity measurement.
Next, create a column that calculates how much the velocity has changed since the previous day. This is the earth's acceleration measurement.
Impulse
In physics, the “impulse” is the force that moves a body — that accelerates it. For earth, you can approximate the impulse acting on earth by calculating how much the earth's acceleration changes over 1 day. For example, acceleration on day 2 minus acceleration on day 1, divided by one day.
Impulse and Earth Tides
You don't need to calculate all of the forces on earth to estimate earth tides. Just use the MICA software to estimate the impulse on earth each day. Then, you plot the data. What do you get? Something like this.
This chart shows on the forces on earth's crust go up and down over time. In my opinion, the risk for earthquakes is greater at the peaks. At the peaks of this chart, the forces on earth's crust are the greatest. This means the chances of a major quake are greatest at the peaks.
Earthquakes — Predicting Earthquakes
Does a chart like this predict the date and location of an earthquake? No.
Does a chart like this predict the risk for someone dying from an earthquake on any given day? Yes.
On the average, more people die from earthquakes on the yellow stripes, than on the green stripes.
To see some of my statistics, go to this page.
Earthquakes — 2004 Indian Ocean Earthquake and Tsunami
2004 Indian Ocean earthquake and tsunami
On December 26, 2004, massive 9.1 to 9.4 earthquake struck off the west coast of Sumatra, Indonesia. The massive earthquake and resulting tsunami killed 230,000–280,000 people.
Was this quake unexpected?
There was a massive impulse on the earth's crust between the dates of 12/11/2004 and 12/16/2004 — a peak that was as bad as they get. (On a scale of 1 to 10, I gave it a 10.) The actual peak for that Earthquake Warning was on 12/14/2004. It was probably on that date that the tidal forces on earth's crust started breaking the rock for this earthquake. After that peak — for about a week — the forces subsided. The impulse on the earth's crust during the following Earthquake Warning was not as strong. My Earthquake Warning lasted from 12/24/2004 to 1/1/2005 — with the peak on 12/28/2004. (On scale of 1 to 10, I only gave it a 3.)
Was this quake expected? Tough question. Nobody would have expected a quake that deadly. With the proper technology, and these statistics, could there have been a warning? I believe the answer is definitely yes. In my opinion, there was probably detectable signatures of massive amounts of breaking rock going back to the date range of 12/11/2004 to 12/16/2004. With the proper technology, an Earthquake & Tsunami Watch could have been in place over a week ahead of time. A warning probably could have been given hours ahead of time. Tremendous amounts of rock fractured — releasing a massive electronic signature. It didn't happen at one instant. The peak lasted minutes. It started hours ahead of time. The clues were probably evident weeks ahead of time. Scientists did have the proper equipment in place. They weren't prepared to spot or measure the clues.
This is a quake that should have had a proper warning.
Earthquakes — Earthquake Watches
On dates where the impulses on the earth's crust are greatest, there should be a worldwide Earthquake Watch. This information should be published by a dedicated scientific group.
This changing risk should be integrated into any earthquake warning system.
Earthquakes — Electromagnetic Signals from Fracturing Rock
When rock breaks, it gives off an electronic signature. This signature can be detected. Detectors should be in place, constantly monitoring the electronic signature of break rock. These signals should be integrated into any Earthquake Warning system.
Earthquakes — Solid Crust Tides
I will go into this in more detail later.
Earthquakes — Earthquake Warning System

Hello, my name is John Nordberg. Welcome to my site. It is a very old website going through some growing pains. I hope you enjoy my vision of time, the grand unification of physics, the solution to fusion energy, a new solution for getting fresh water in hot deserts, and a solution to global warming.
Follow @johntnordberg
Please Help Out & Donate
Earthquake Risk
Prediction of current World-Wide Earthquake Risk:
Earthquake Information Other: A, B, C
Store

Keywords
Physics, Time, What is Time?, Grand Unification, GUT, Theory of Everything, TOE, The Speed-of-Light Definition of Time, The Ball-of-Light Particle Model, John Nordberg, Photons, Relativity, Astronomy, Desert Oasification Atmospheric Water Generators, DOAWG, Fusion, Fusion Energy, NFT
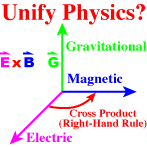
This 3-dimensional, geometric equation, is the key to unifying physics. Basically, it states that if you take the “cross product x“ of the electric field vector E and the magnetic field vector B, the result is the gravitational field vector G.Do not confuse the gravitational field “vector G“ (it has a small arrow above it) with the Gravitational constant (which is represented by a big "G" without a vector arrow above it) or with gravitational acceleration (which is represented by just a small "g").
Crowdfunding
- GoFundMe (Donations)
- Kickstarter (Rewards)
- Crowdfunder (Equity)
Blog Entries
- A WordPress Blog is being planned
Videos
Patents
Recent Updates
- Earthquakes
- Under Construction
- Under Construction
External Links